

Structure Charts
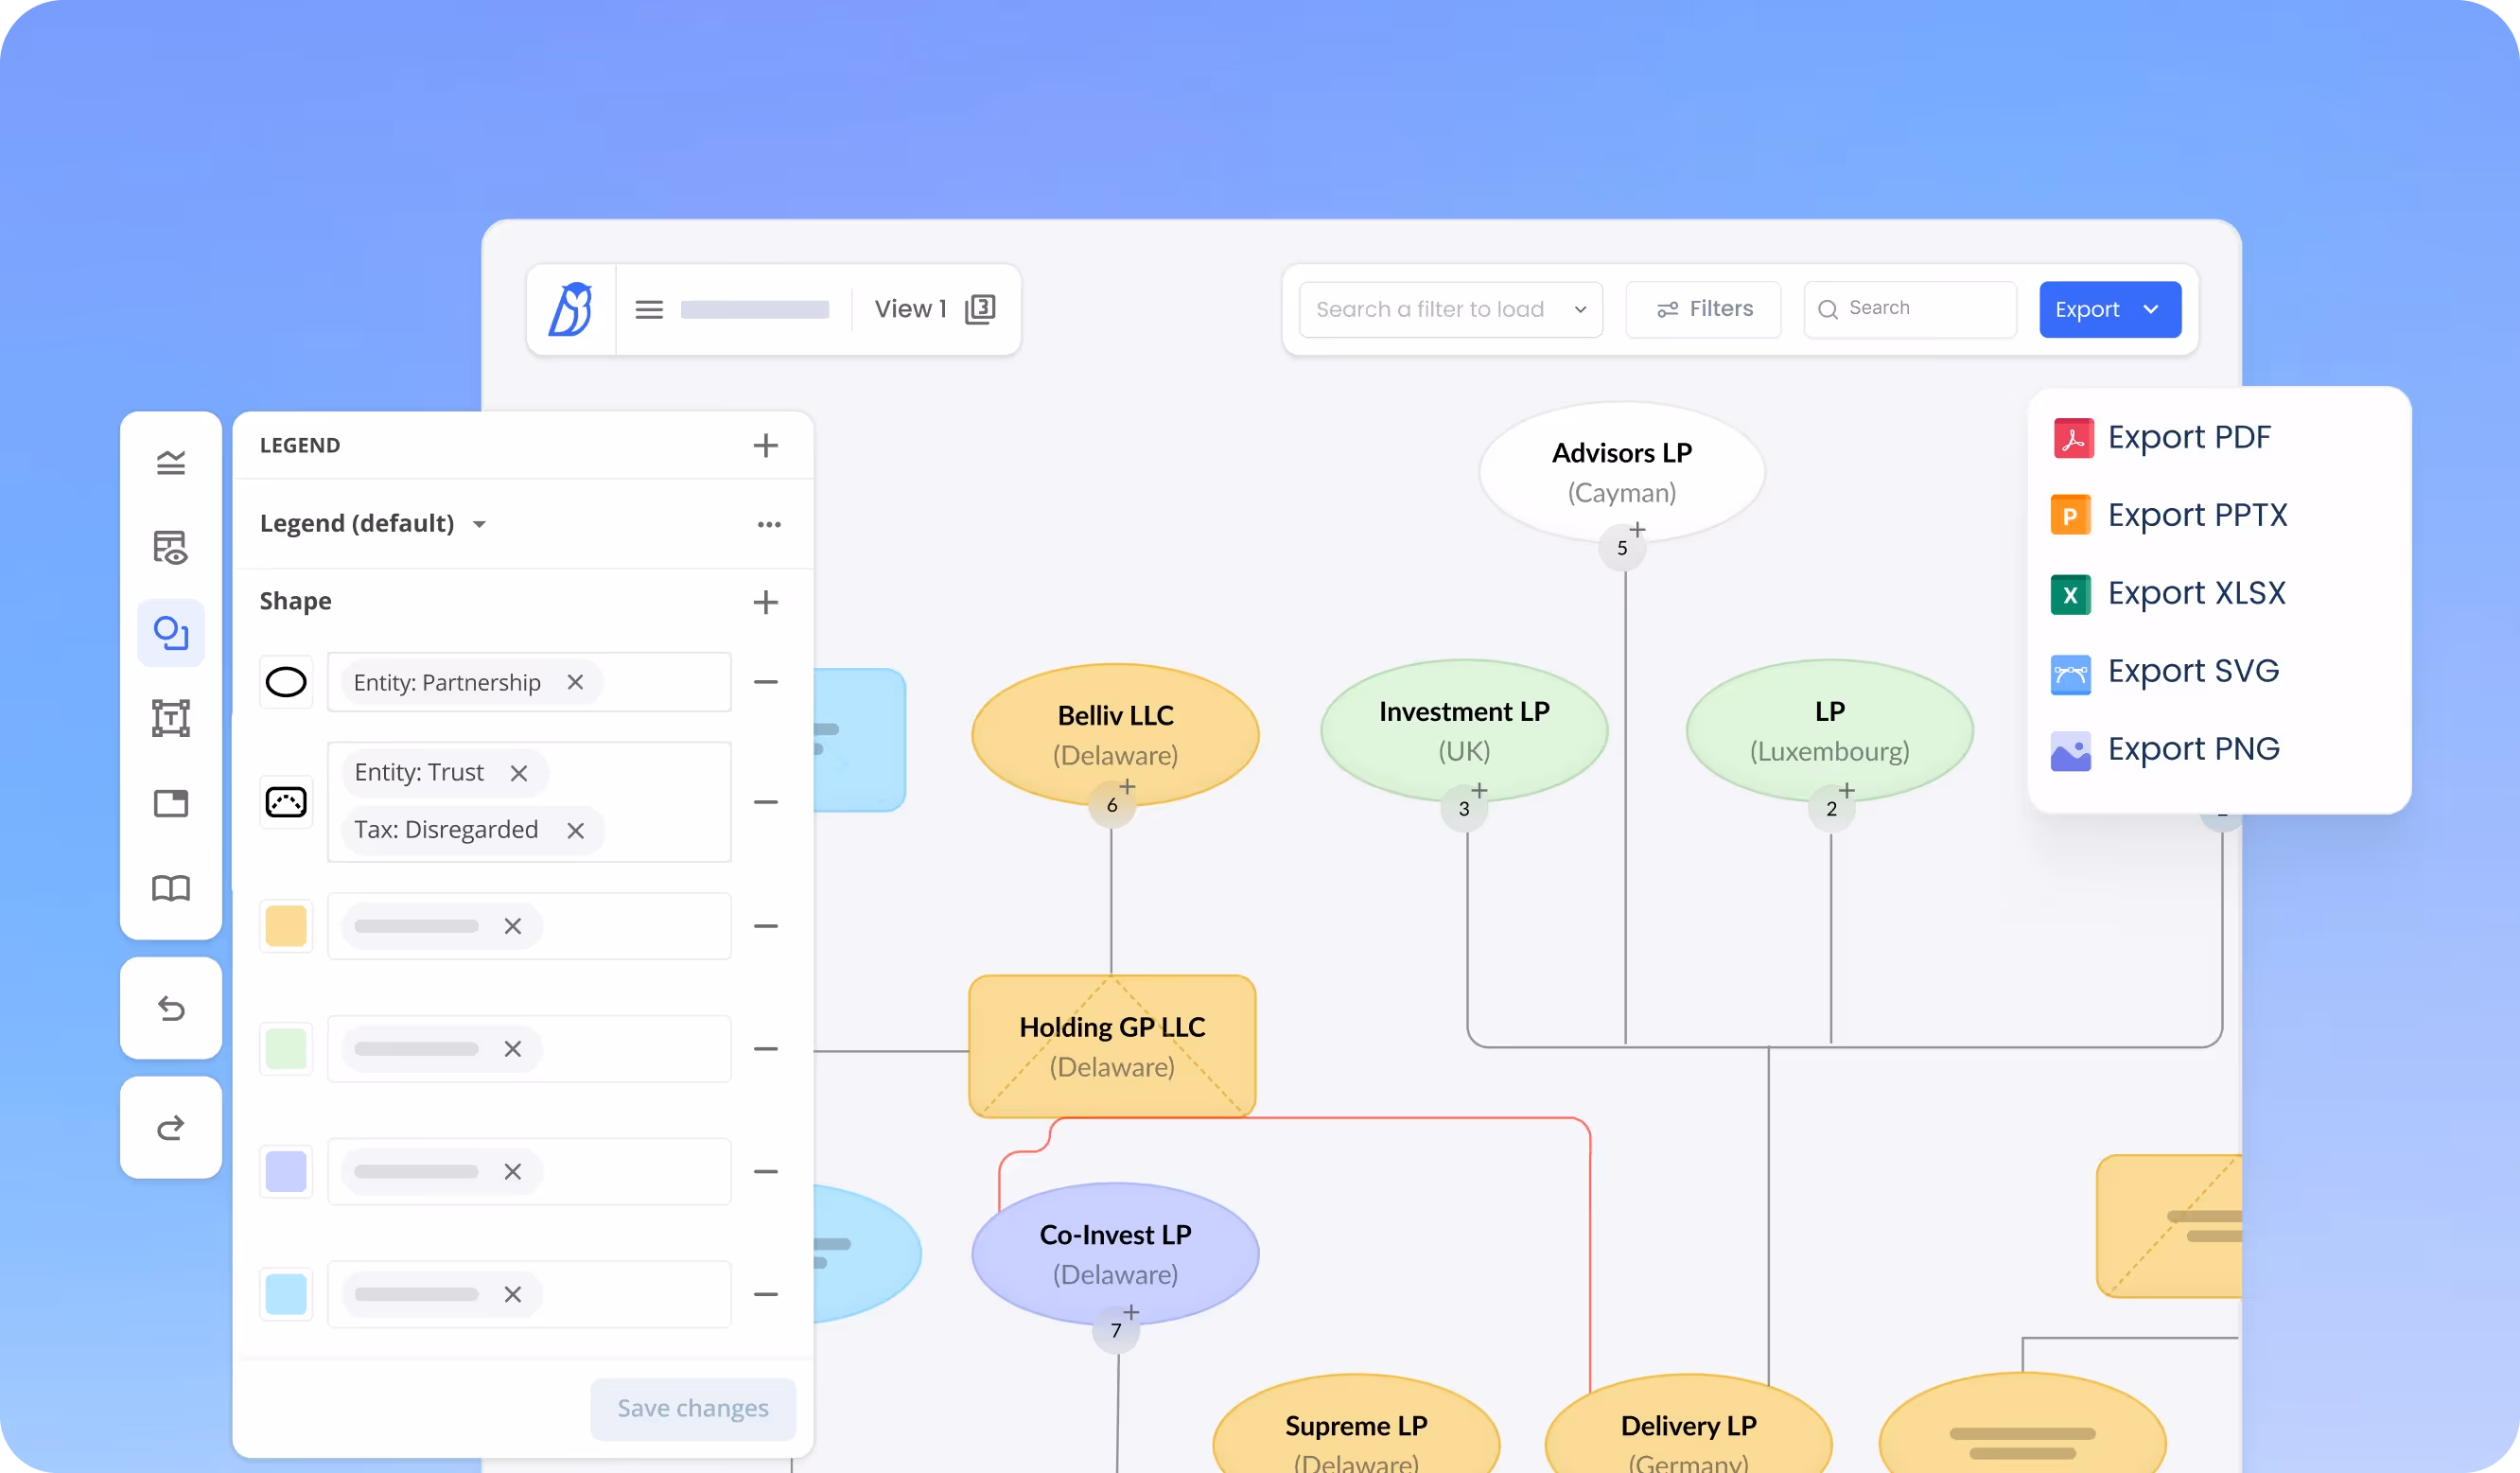
Generate dynamic, real-time visualizations of ownership, governance and financing relationships across entities. Athennian transforms complex data into clear, actionable charts that support improved decision-making, compliance and stakeholder communication.


%201.png)


What you can do
Generate ownership and relationship charts that reflect the most up-to-date entity, equity and debt data.
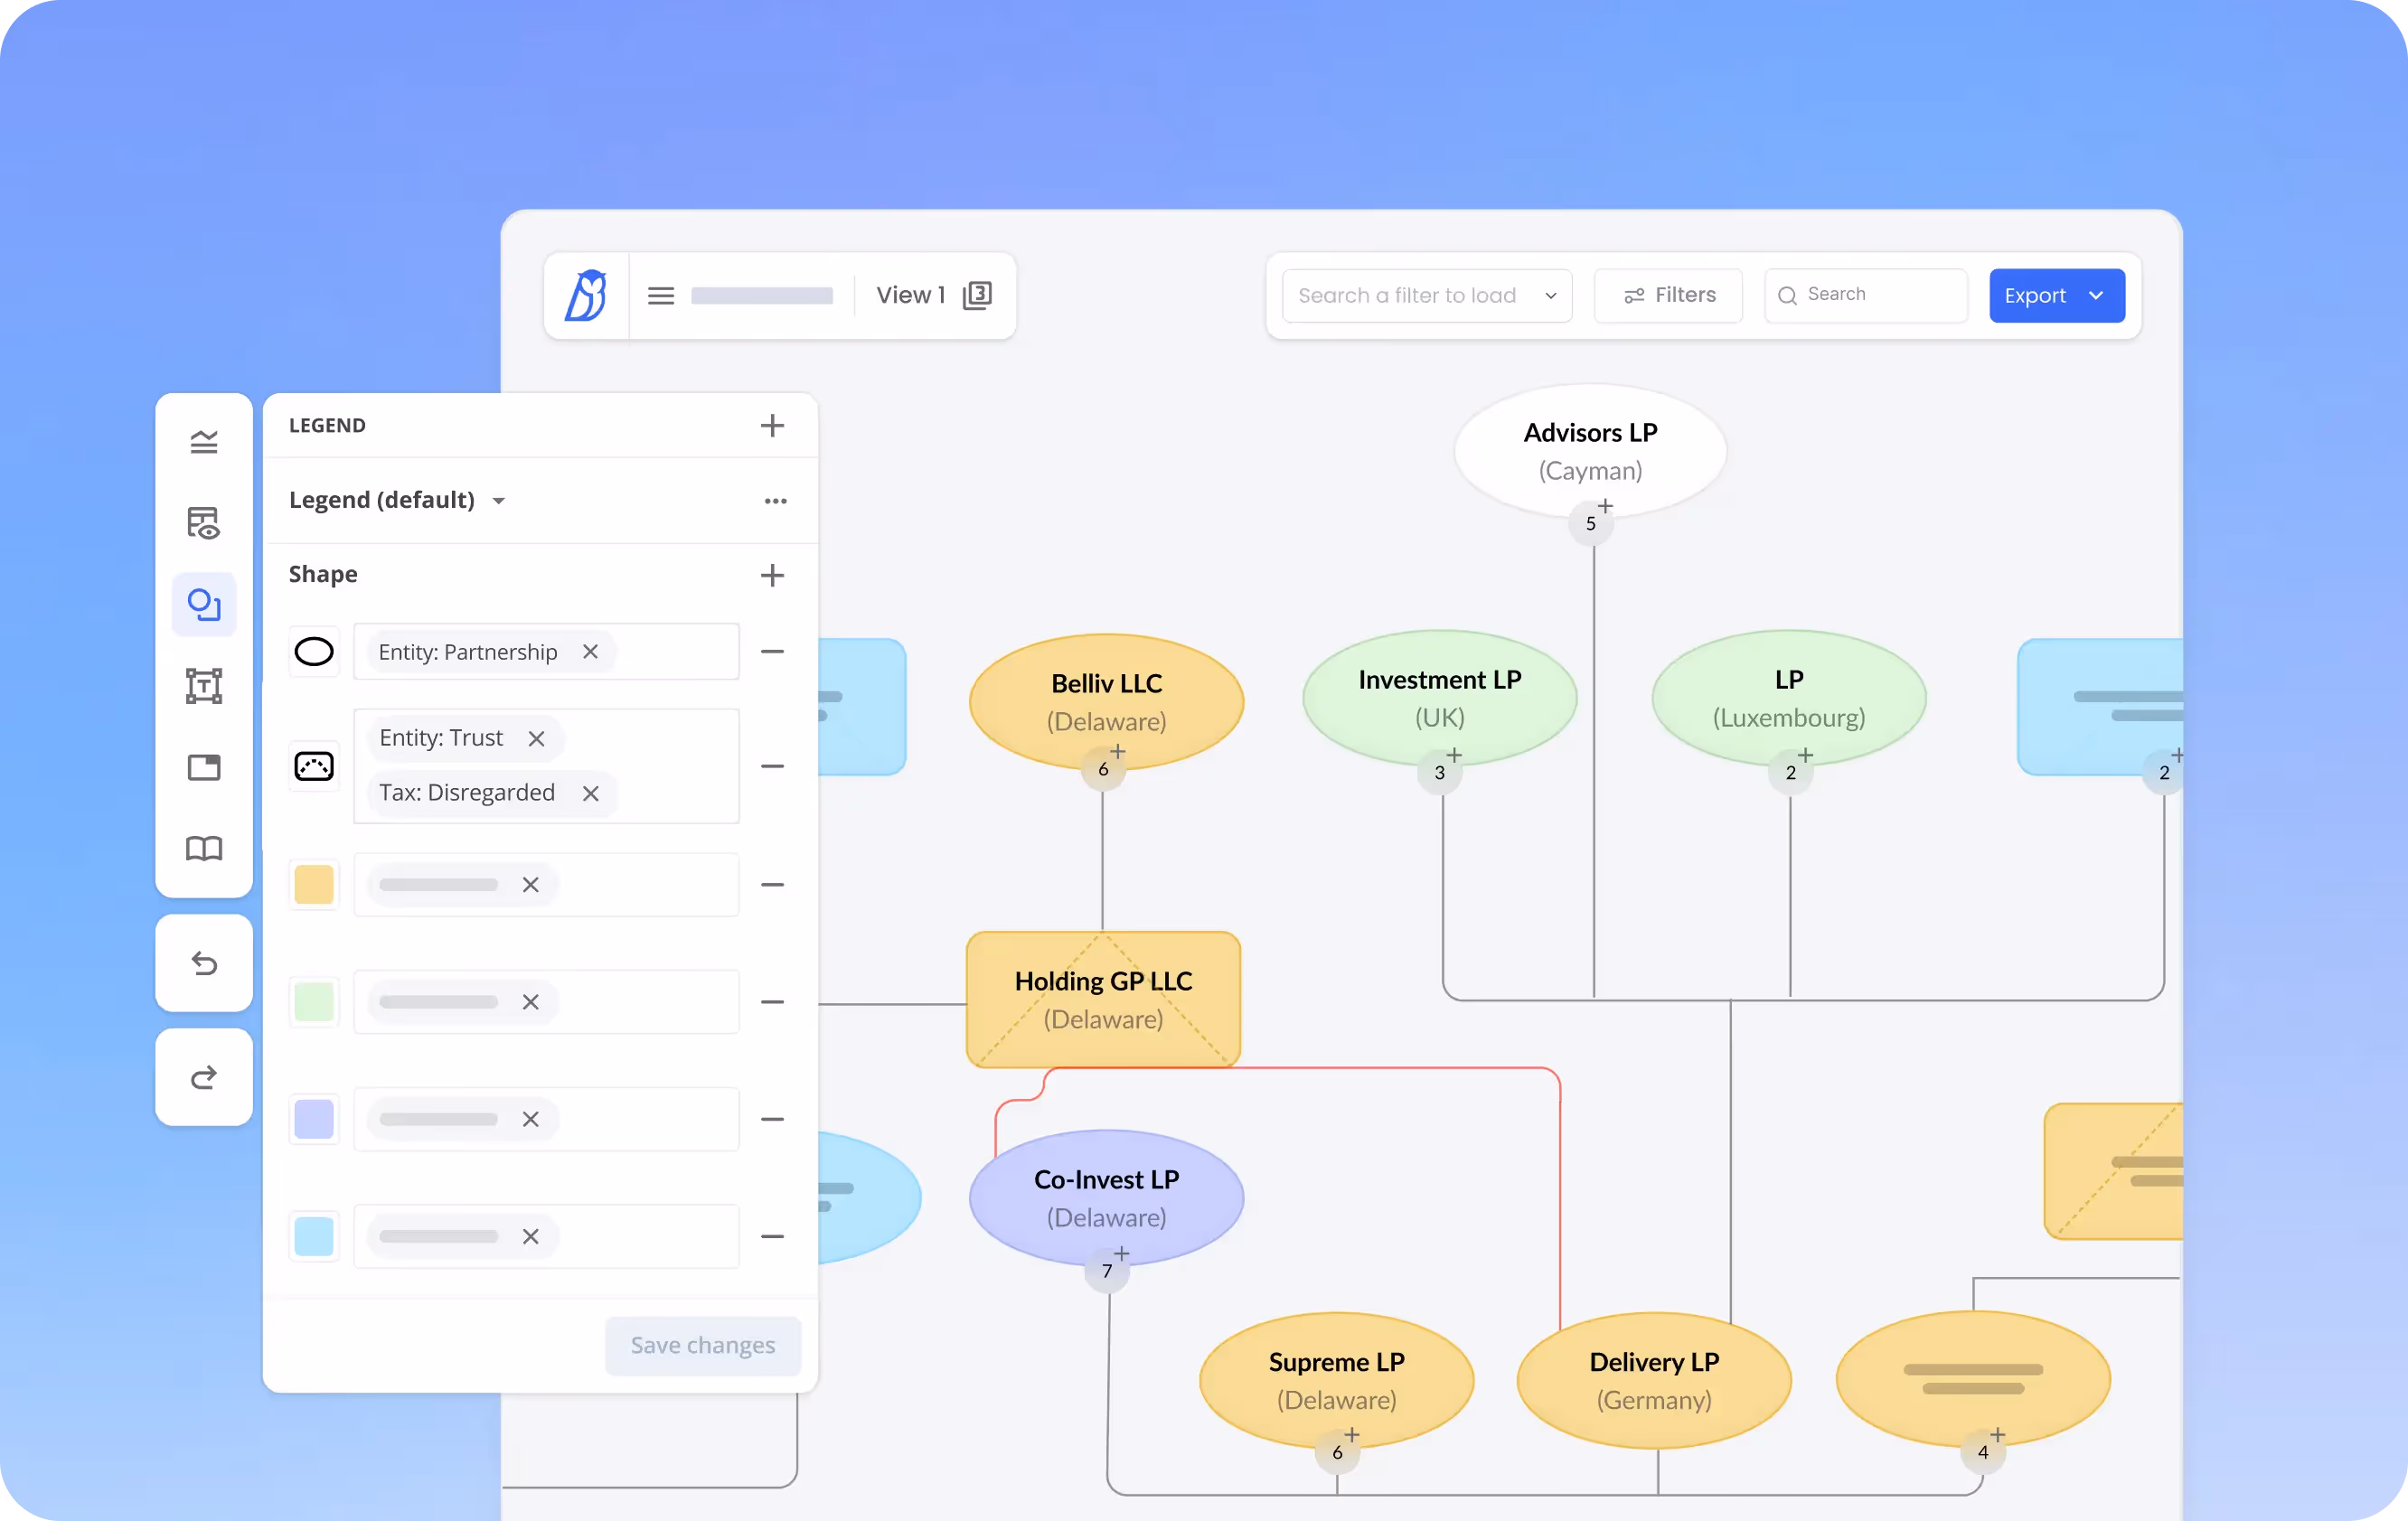
Map appointments, control roles and D&O relationships across subsidiaries and jurisdictions.

Show layered capital structures, shareholder breakdowns and funding flows at a glance.
Filter by region, entity type, ownership percentage or custom tags to build fit-for-purpose diagrams.
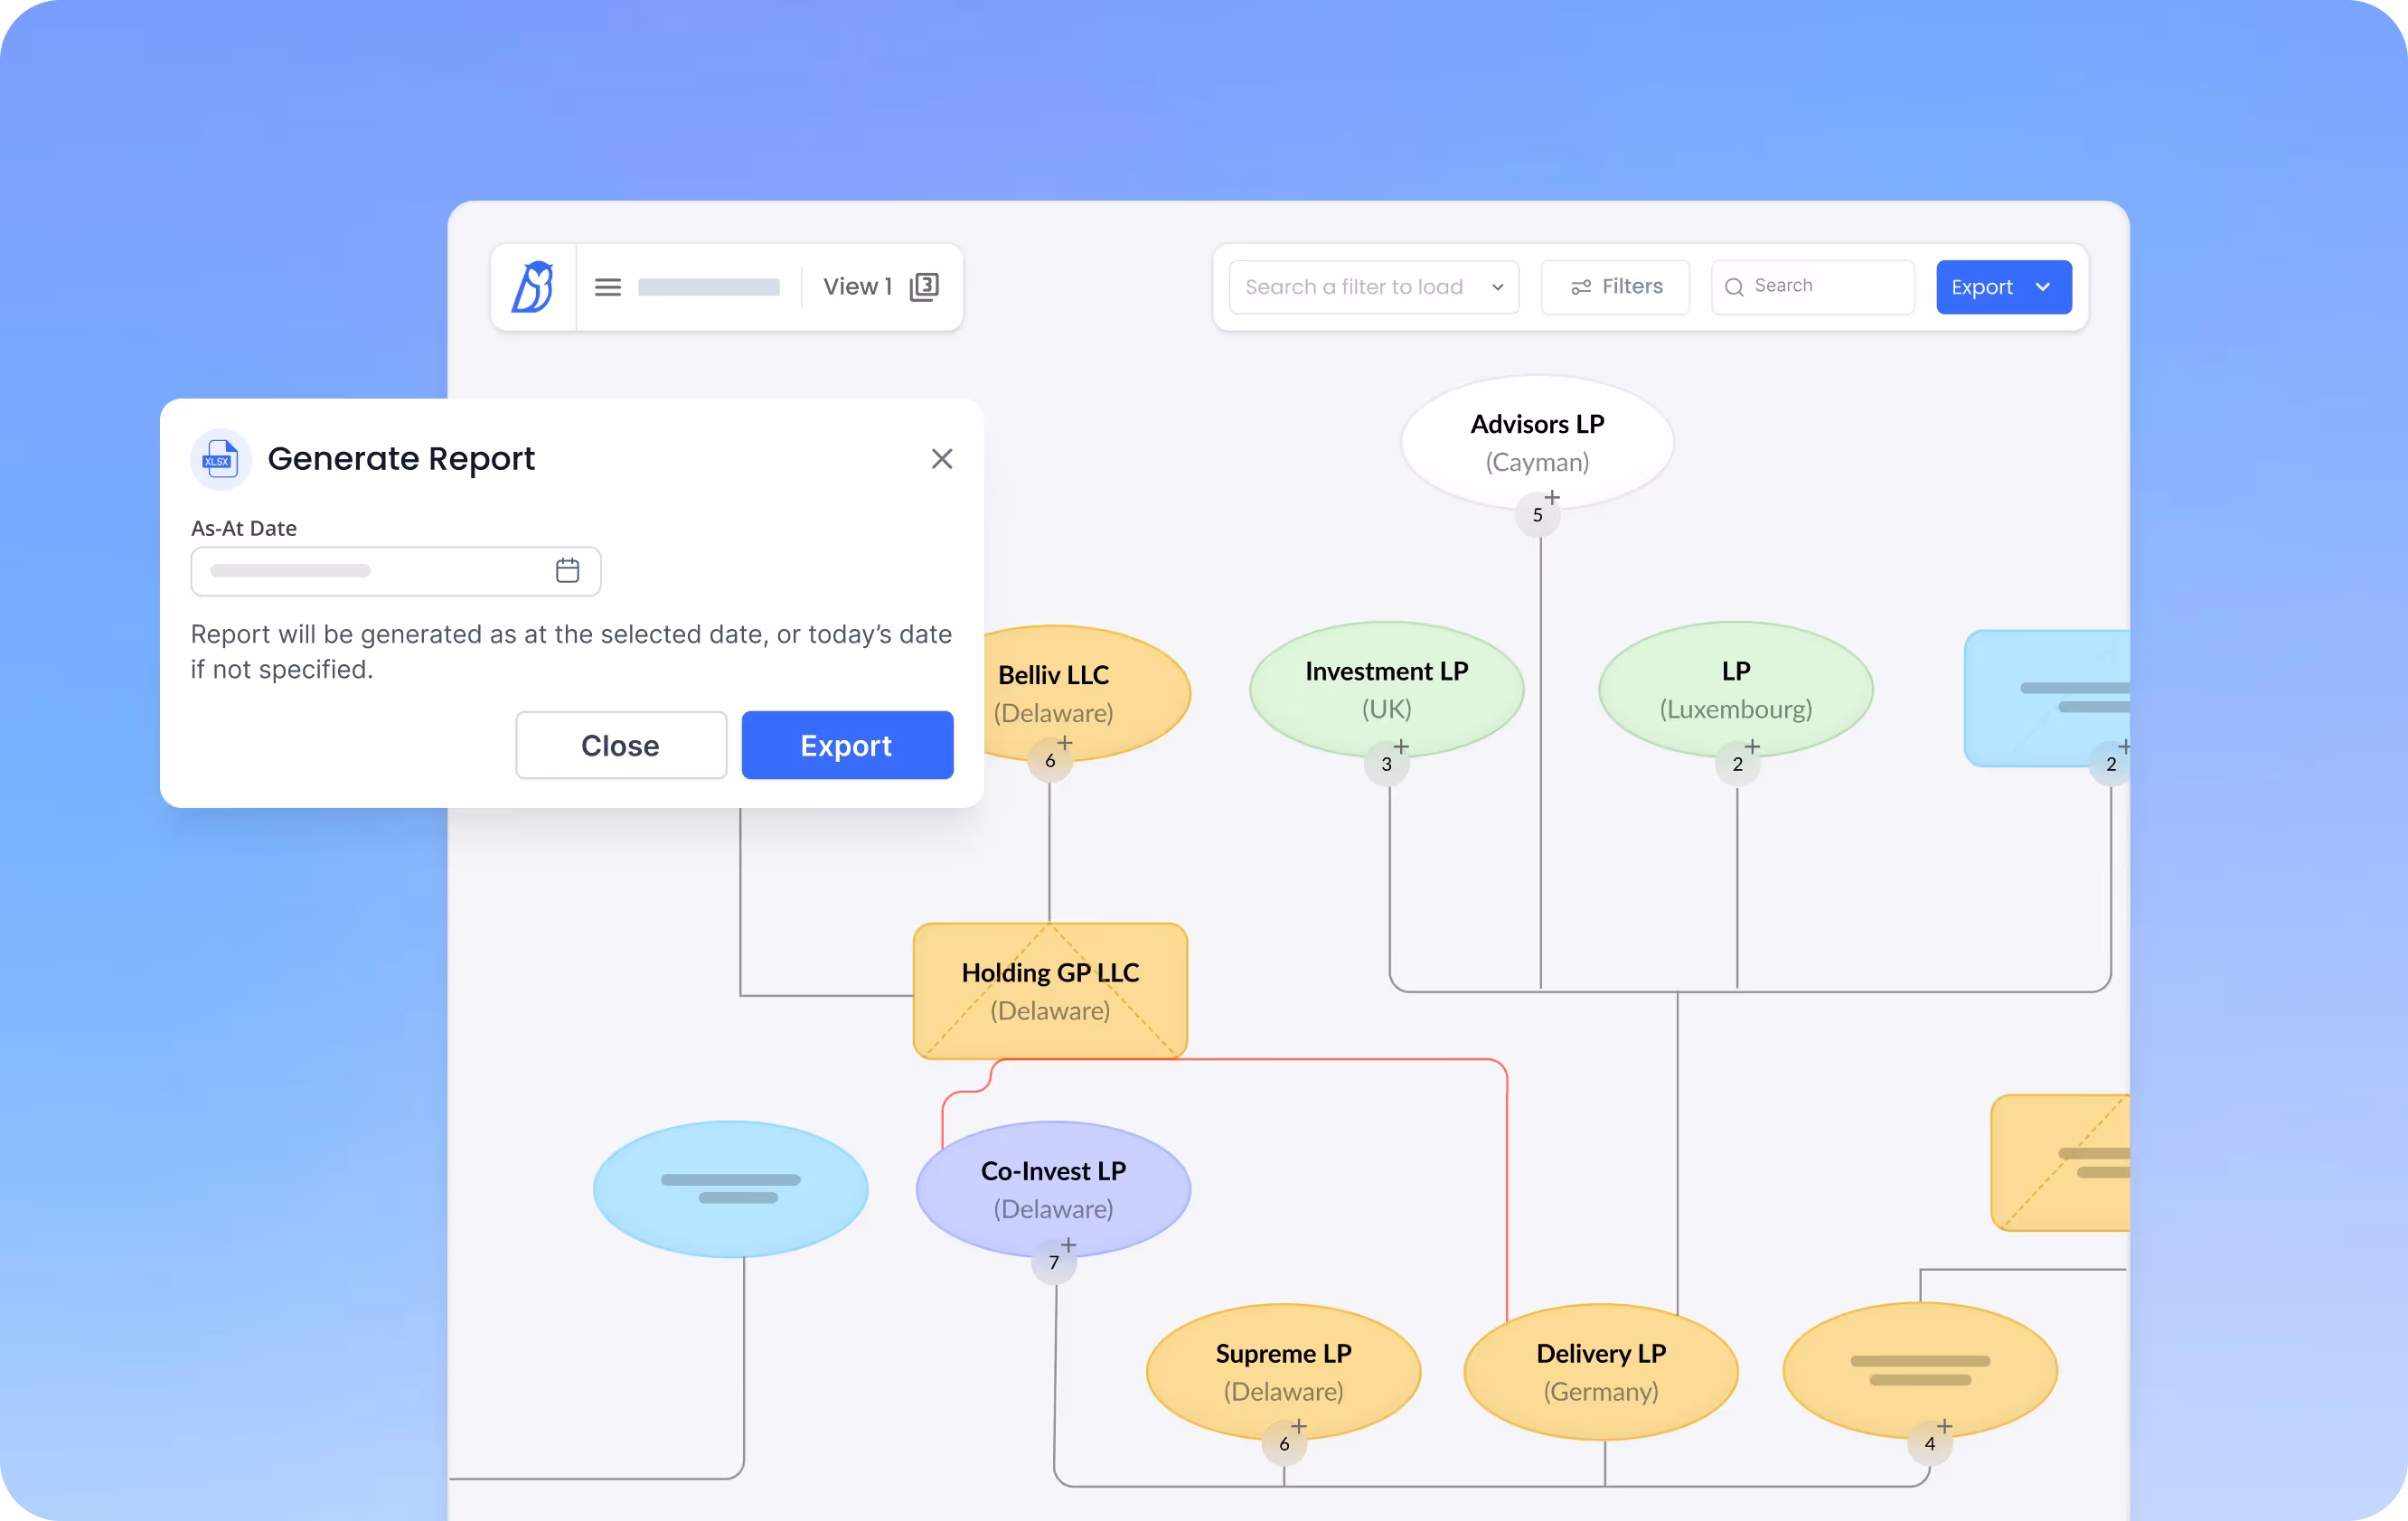
Download charts as PDFs or image files to support board meetings, audits or transaction planning.
Ensure internal and external stakeholders are all working from the same accurate structure view, with no manual updates needed.
.webp)

What you get

Instant Clarity
Replace manual org charts and version confusion with real-time visualizations that reflect accurate data.

Better Decision Support
Enable legal, tax and finance teams to act quickly with clear insight into ownership and control structures.
.svg)
Proactive Governance
Spot gaps, overlaps or outdated appointments before they become risks and act on them with confidence.
One Governance Ops™ solution
for modern entity management
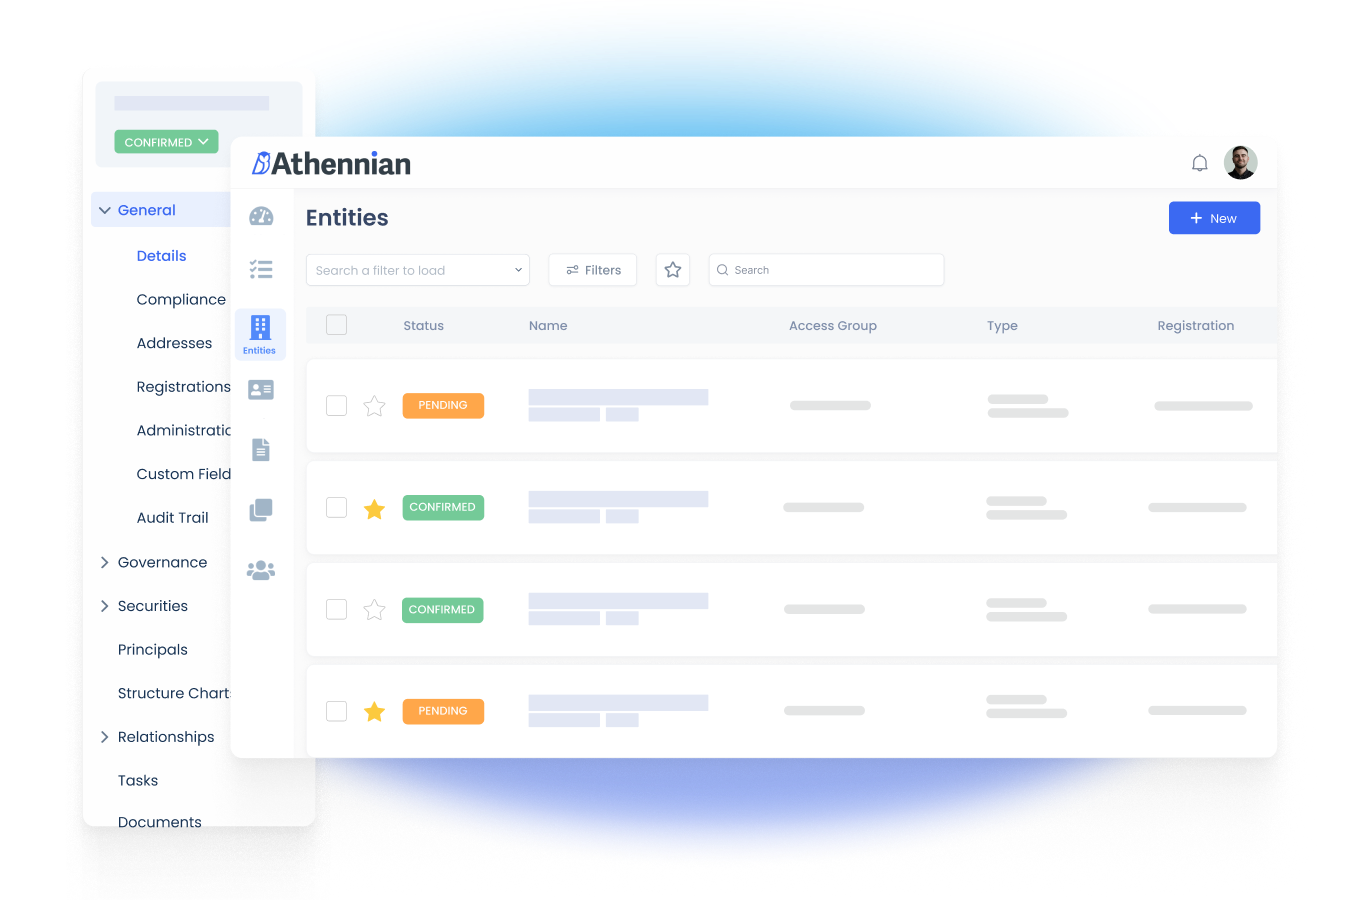
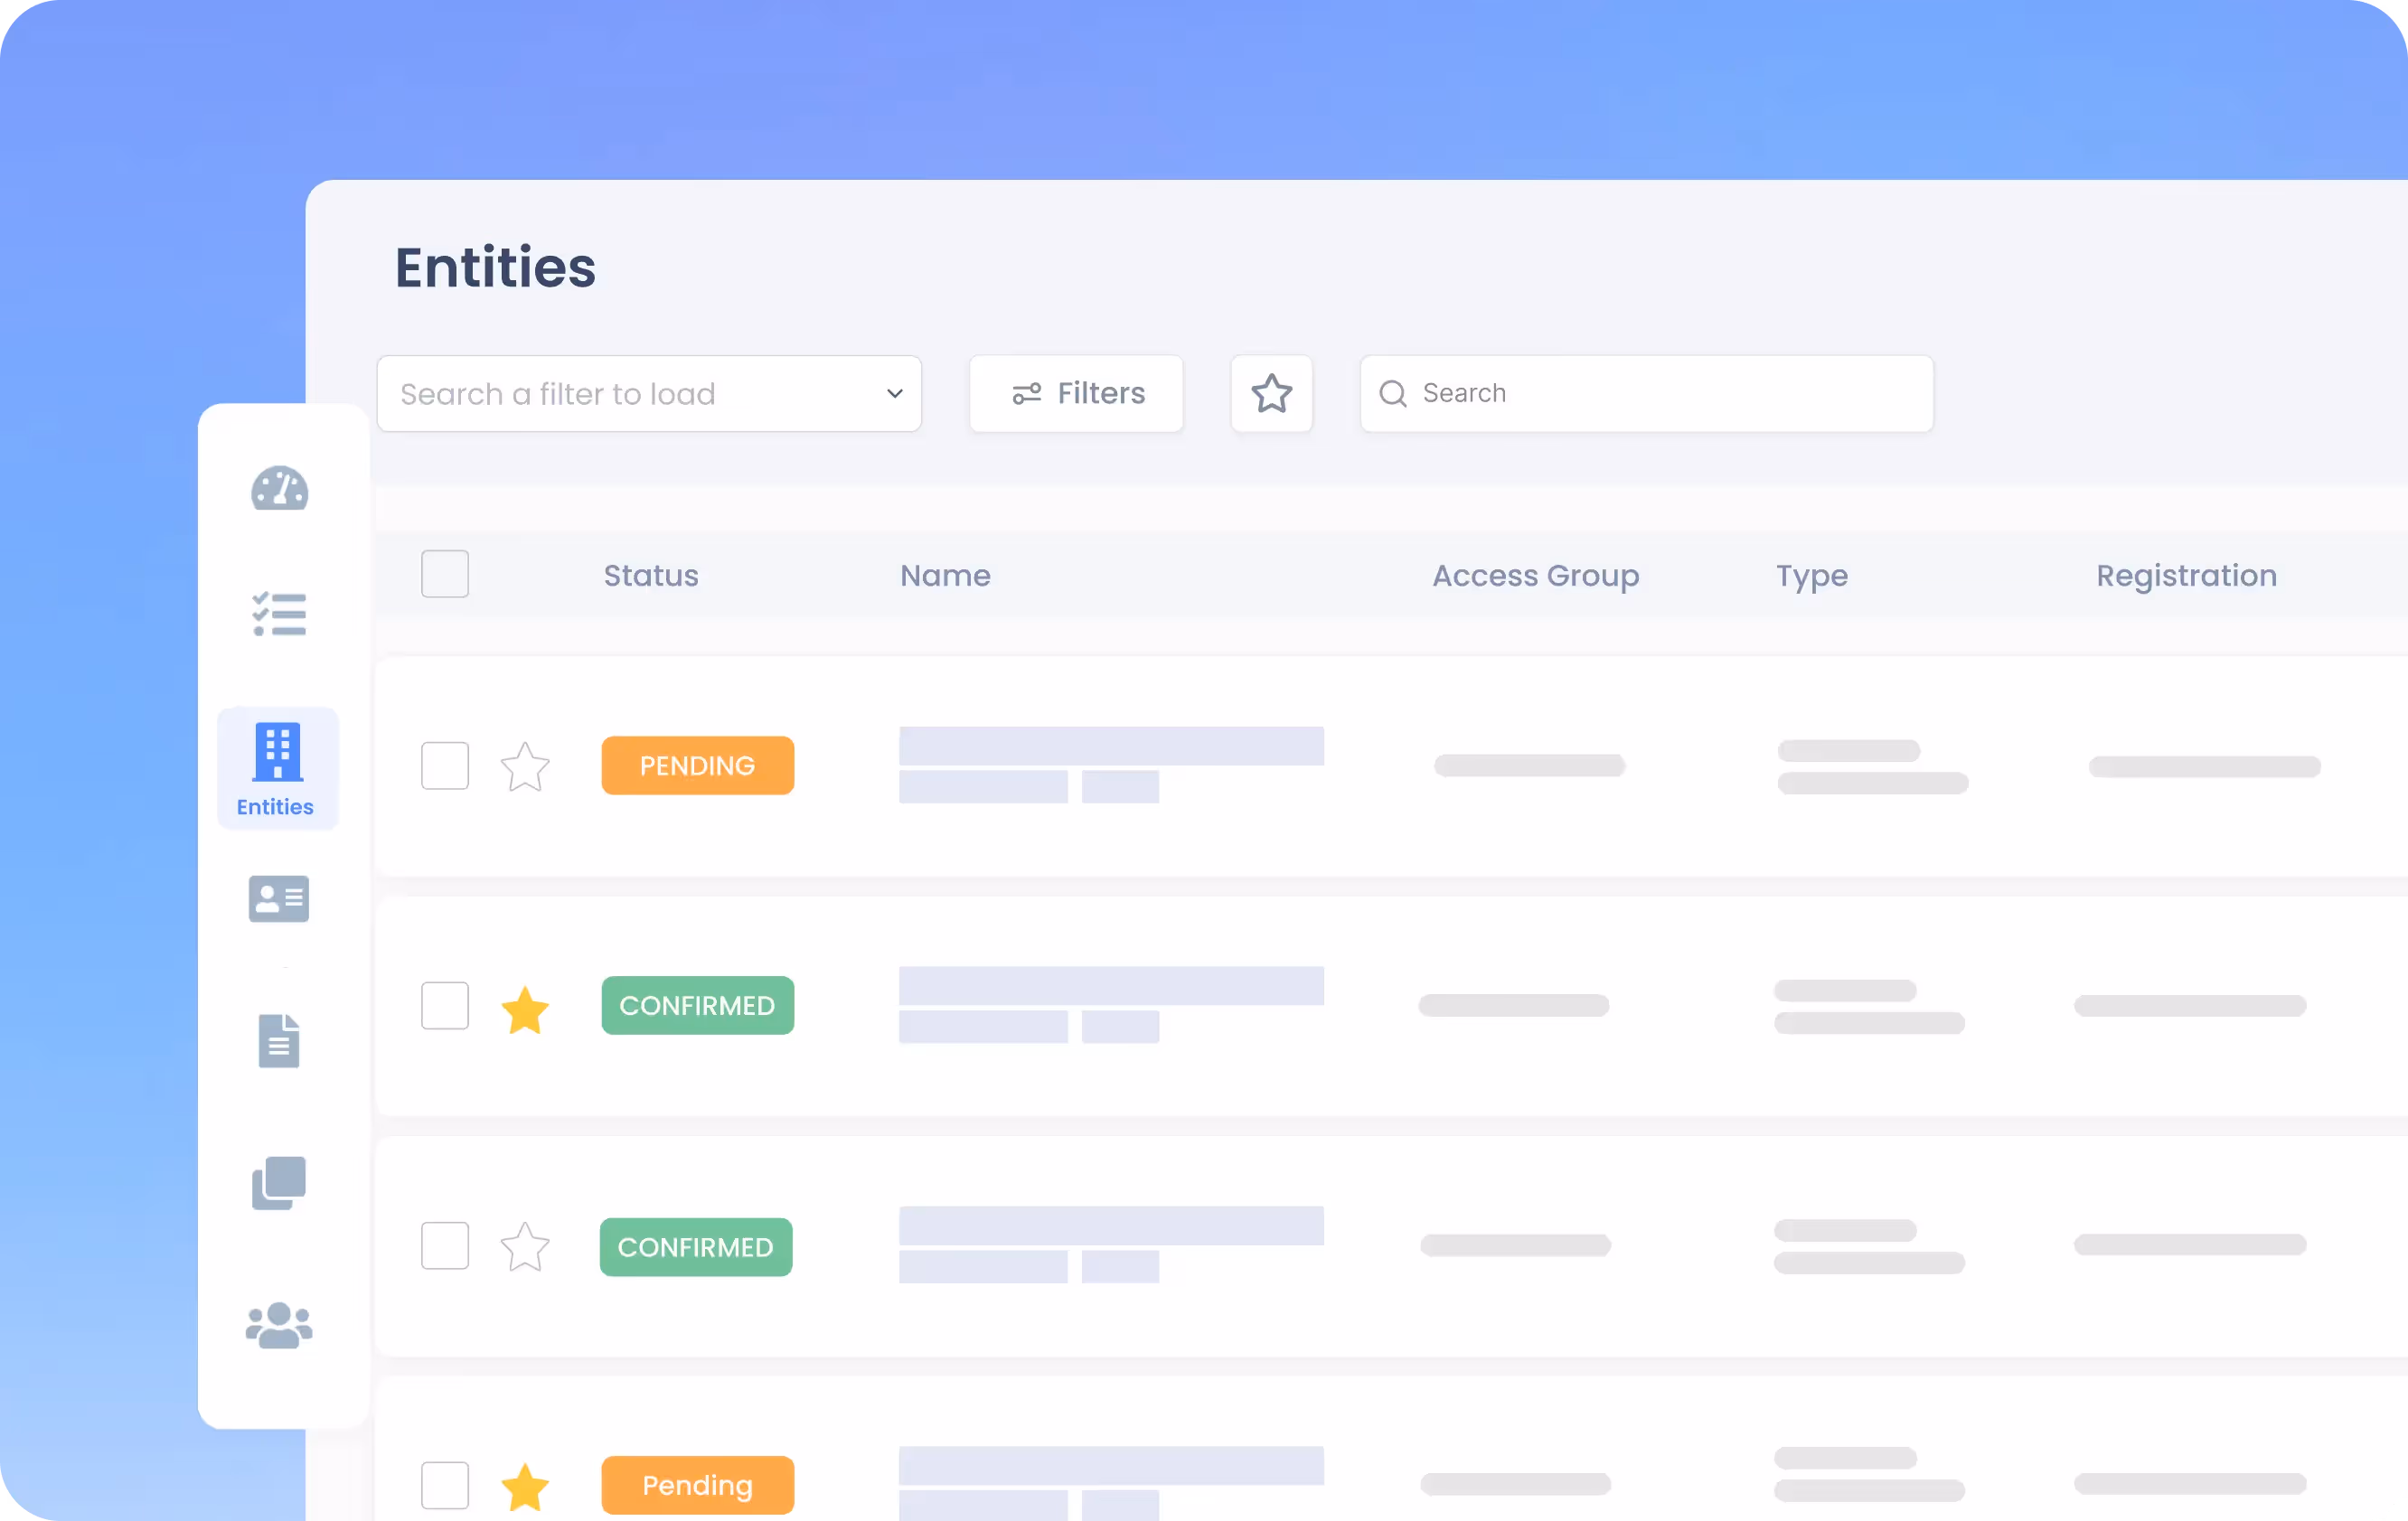
Entity & People Records
Record entity details, appointment, addresses, KYC, registrations and compliance details in reportable and searchable profiles.
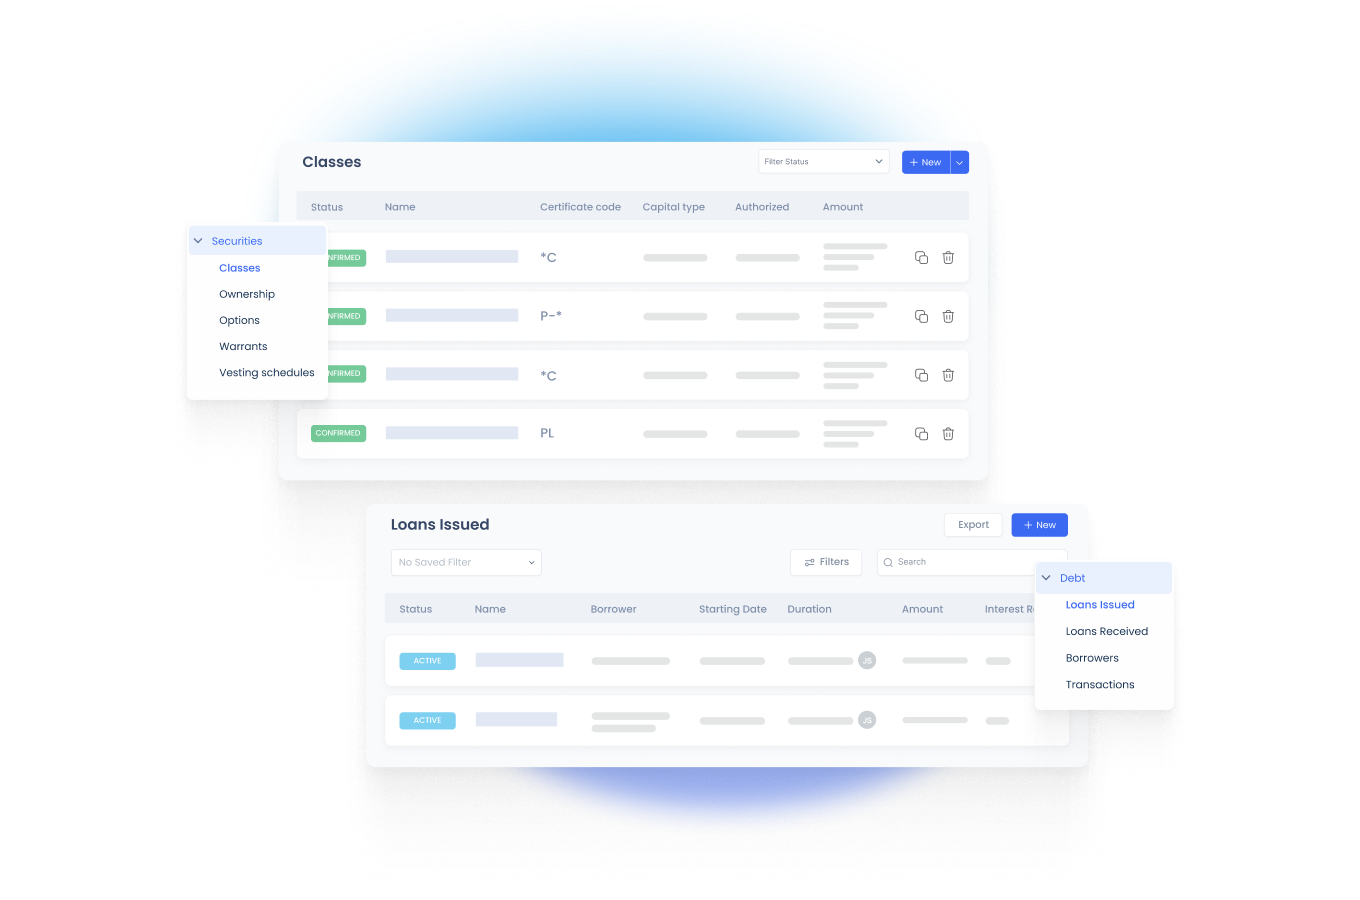
Equity & Debt Structures
Manage cap tables, equity and debt transactions, records and structure across industries.
.webp)
Structure Charts
Instantly produce dynamic charts that reflect ownership, governance and commercial relationships.

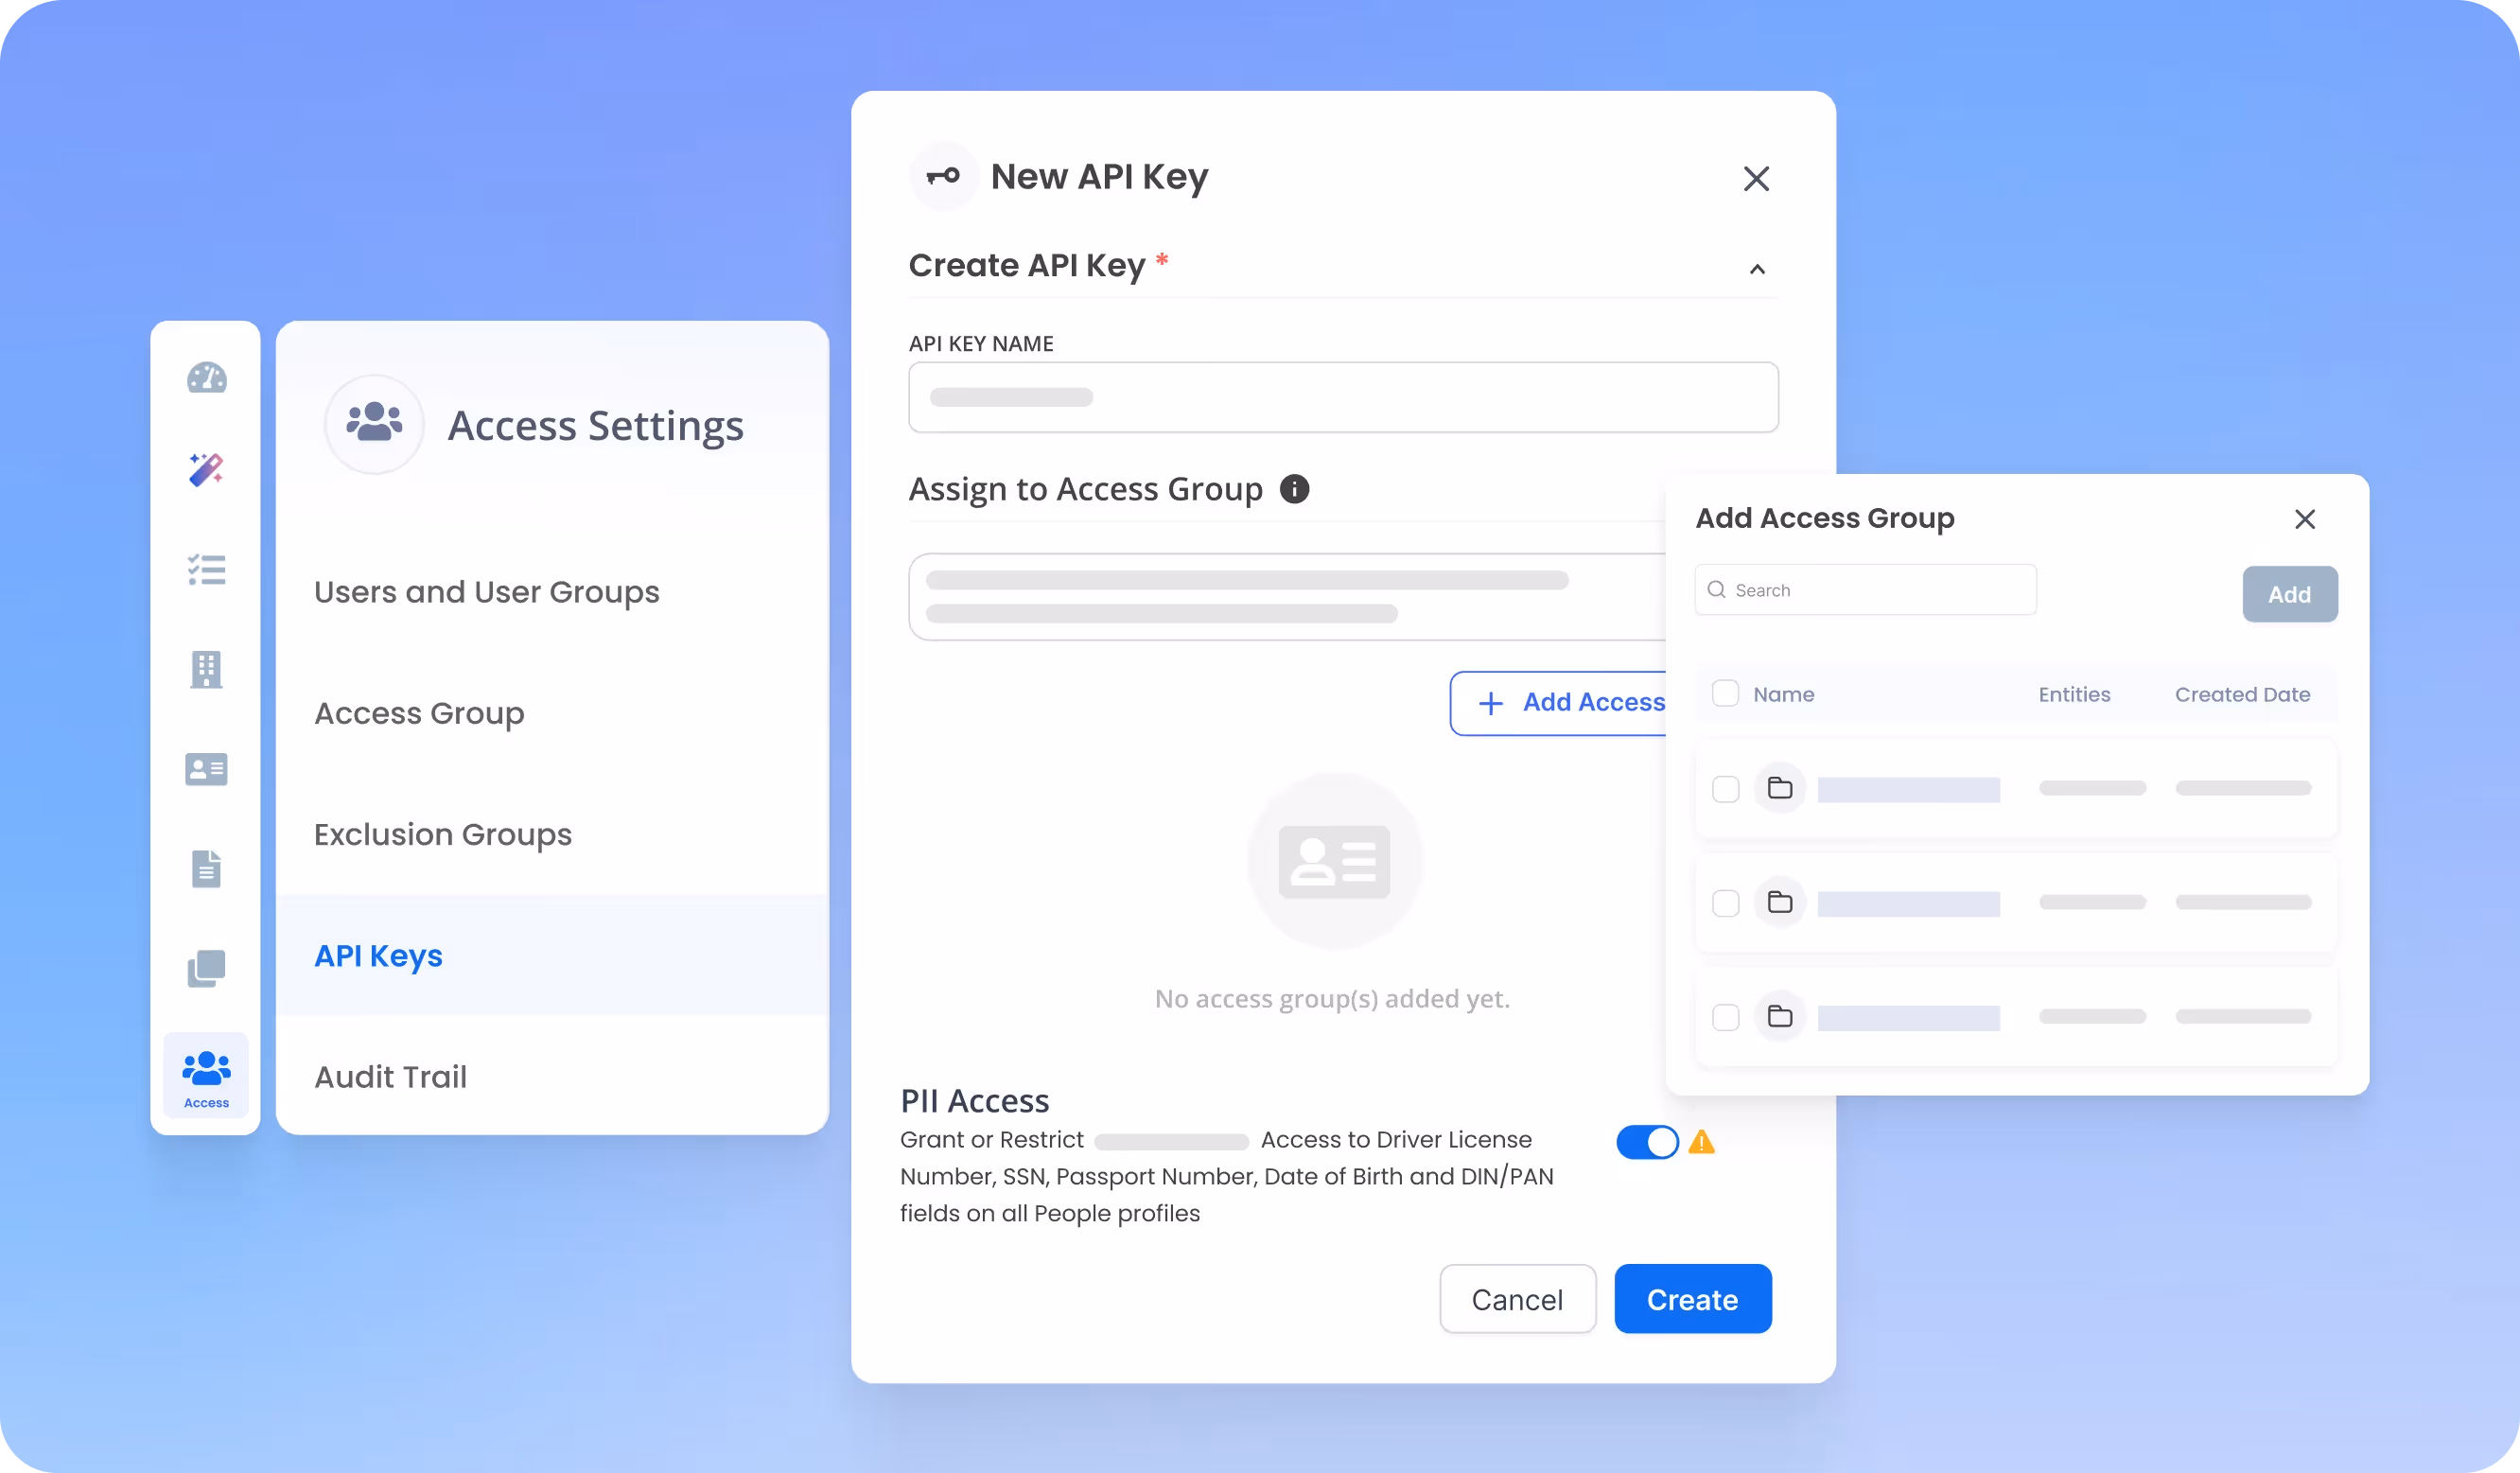
Controls & Governance
Control and monitor your source of truth with granular permissions, audit trails and custom fields to ensure data integrity.
.webp)
Document Management
Store, edit and automate templates, use electronic signatures, and control access to sensitive documents.

Appointments/D&O
Record, link and automate any appointment such as director, officer, power of attorney or signing authority.

Tasks & Reports
Track compliance dates and significant events, and create custom task lists for various activities and milestones.

Athennian AI
Remove the cost, time and risk of manual data entry and initial onboarding, M&A and ongoing maintenance.

.svg)
See your structure clearly and instantly
Talk to us about how Athennian can help your teams today.
Request a demo
Frequently Asked Questions
Athennian creates dynamic charts that visualize legal, equity and debt relationships across entities. Charts can represent ownership percentages, governance roles, layered funding flows and control structures, all sourced from real-time entity data.
Structure charts reflect live data. Any changes to appointments, equity positions or entity records are automatically incorporated into the visualizations, so your charts are always current and aligned with your records.
Yes. You can filter charts by jurisdiction, ownership threshold, entity type or role, and apply tags or custom views for different audiences, for example for audit committees or transaction teams.
Absolutely. You can export charts as image files or PDFs, which are useful for investor communications, board presentations or due diligence reviews. The exported visuals match the live data set.
They provide a clear snapshot of ownership and control relationships that are often required in regulatory disclosures or audit documentation. With charts linked to your compliance records, you can quickly demonstrate legal structure and oversight.
Yes. Structure charts help transaction teams visualize control, equity flow and subsidiary risk. They support restructuring, M&A due diligence and financing scenarios, enabling faster and better-informed decisions.
Unlike static visuals built in PowerPoint or Visio, Athennian’s charts are automatically generated from verified data and require no manual updates. This eliminates version confusion and reduces risk in fast-moving governance environments.
-p-500.webp)
-p-500.webp)
-p-500.webp)
.webp)
